Sovereign sustainability is challenging and complex, yes. But when assessing the performance of countries it is vital to understand how national wealth per capita plays into the picture. ‘Ingrained income bias,’ as the World Bank calls it, always looms large for government bondholders. It is best known as a problem for emerging markets investors with sustainability-focused screens or tilts because of its impact on the performance of low-income countries in urgent need of finance for sustainable development. However, it also makes it harder to meaningfully integrate ESG in developed-market portfolios, which encompass a range of per capita income levels.
Our data reveals that some of the real outperformers are not the largest, most prominent or most vocal on sustainability issues on the global stage. Instead, Uruguay, the Baltic States and some of the other small EU nations punch well above their weight on environmental and social issues. Conversely, the US, Japan and many Middle Eastern countries could be doing more given their wealth levels, particularly on rights issues and carbon policy.
Top 10: Uruguay leads an otherwise European field of income-adjusted outperformance
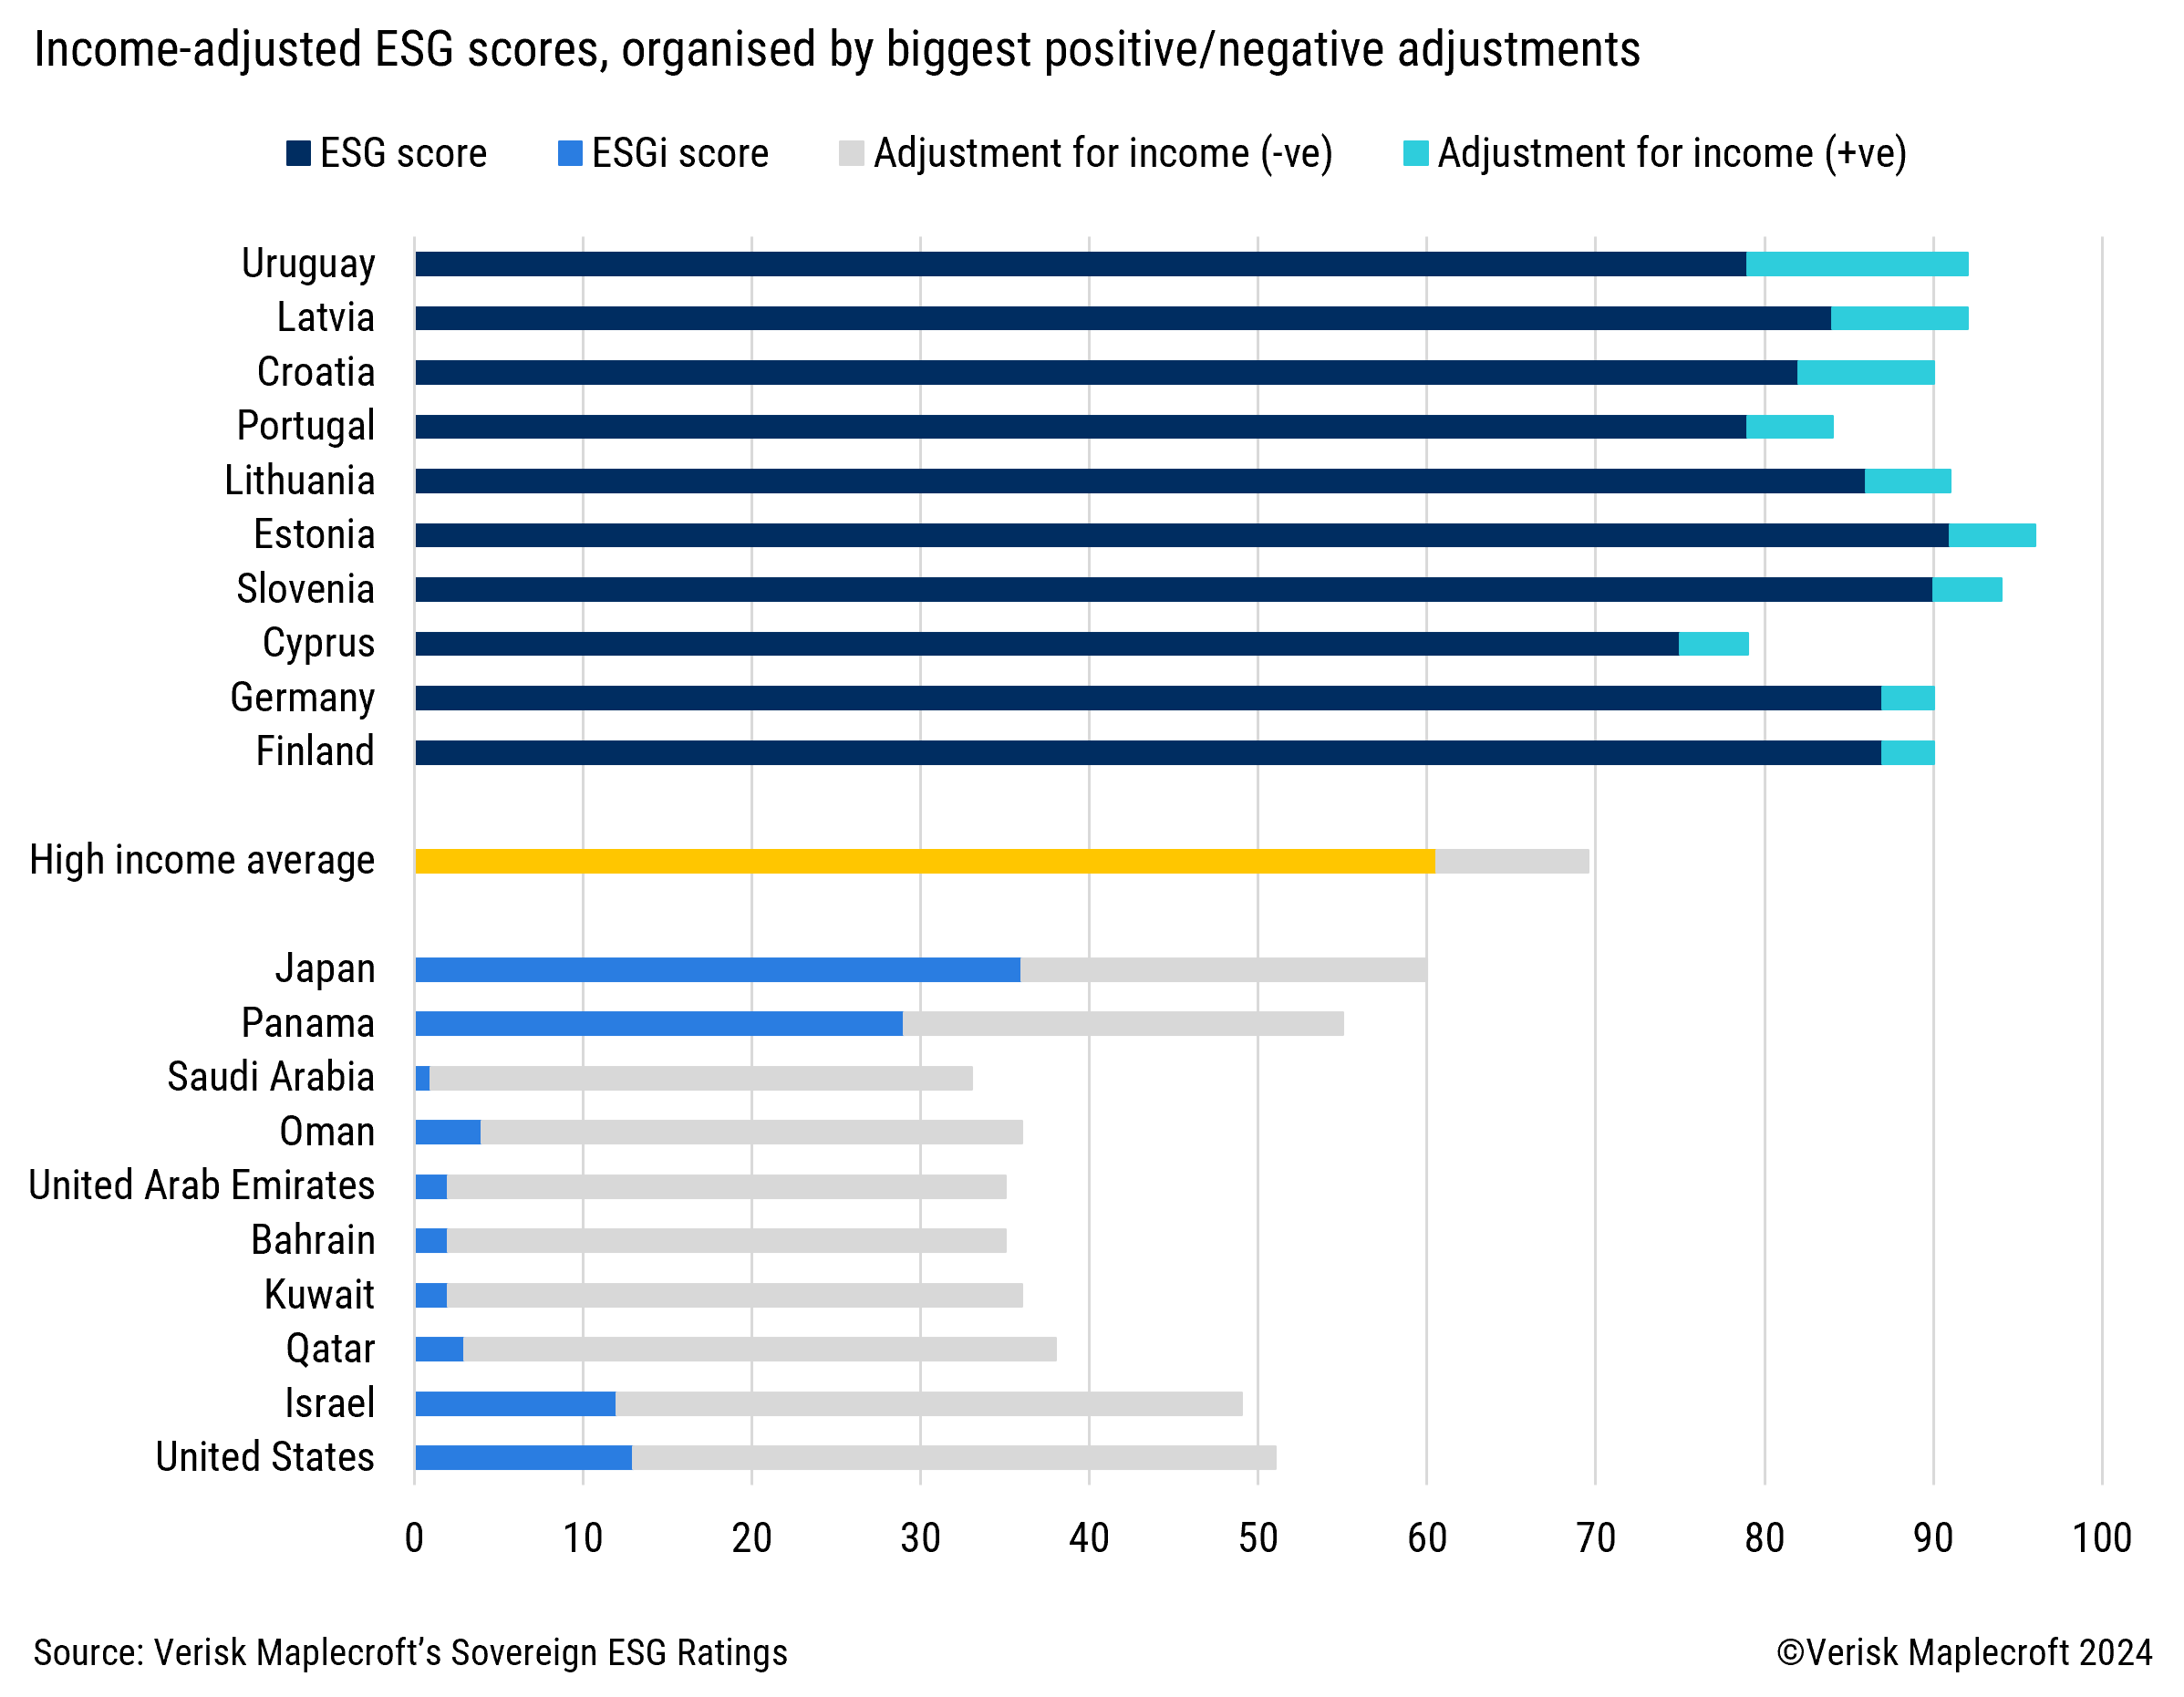
We account for these economic disparities in our Sovereign ESG Ratings with additional income-adjusted (ESGi) scores and ratings that appraise countries fairly across E, S and G (and ESG overall) by using non-parametric regression to compare their performance to what we would expect given their levels of per capita income (see Focus Box). The process unsurprisingly tends overall to lower rather than boost the scores of high-income countries. This can be seen in Figure 1, which displays the 10 best and worst major high-income countries when it comes to the direction and magnitude of adjustment: negative adjustments for the worst significantly outweigh positive impacts for the best, and the average adjustment across the whole income group is negative.
Seen through this lens, the top 10 countries nevertheless represent a compelling group of best-in-class performers. Among these, Uruguay receives the largest income adjustment boost. Long seen as a beacon of sustainability in Latin America, Uruguay was an early mover on renewable energy and on labelled bond issuance and enjoys a stable and progressive policy environment. In the Americas, the country’s unadjusted ESG score of 79/100 and 4+ ESG rating are second only to Canada, which it eclipses with its income-adjusted score of 92/100 thanks to particularly strong performance in the Social and Environment pillars.
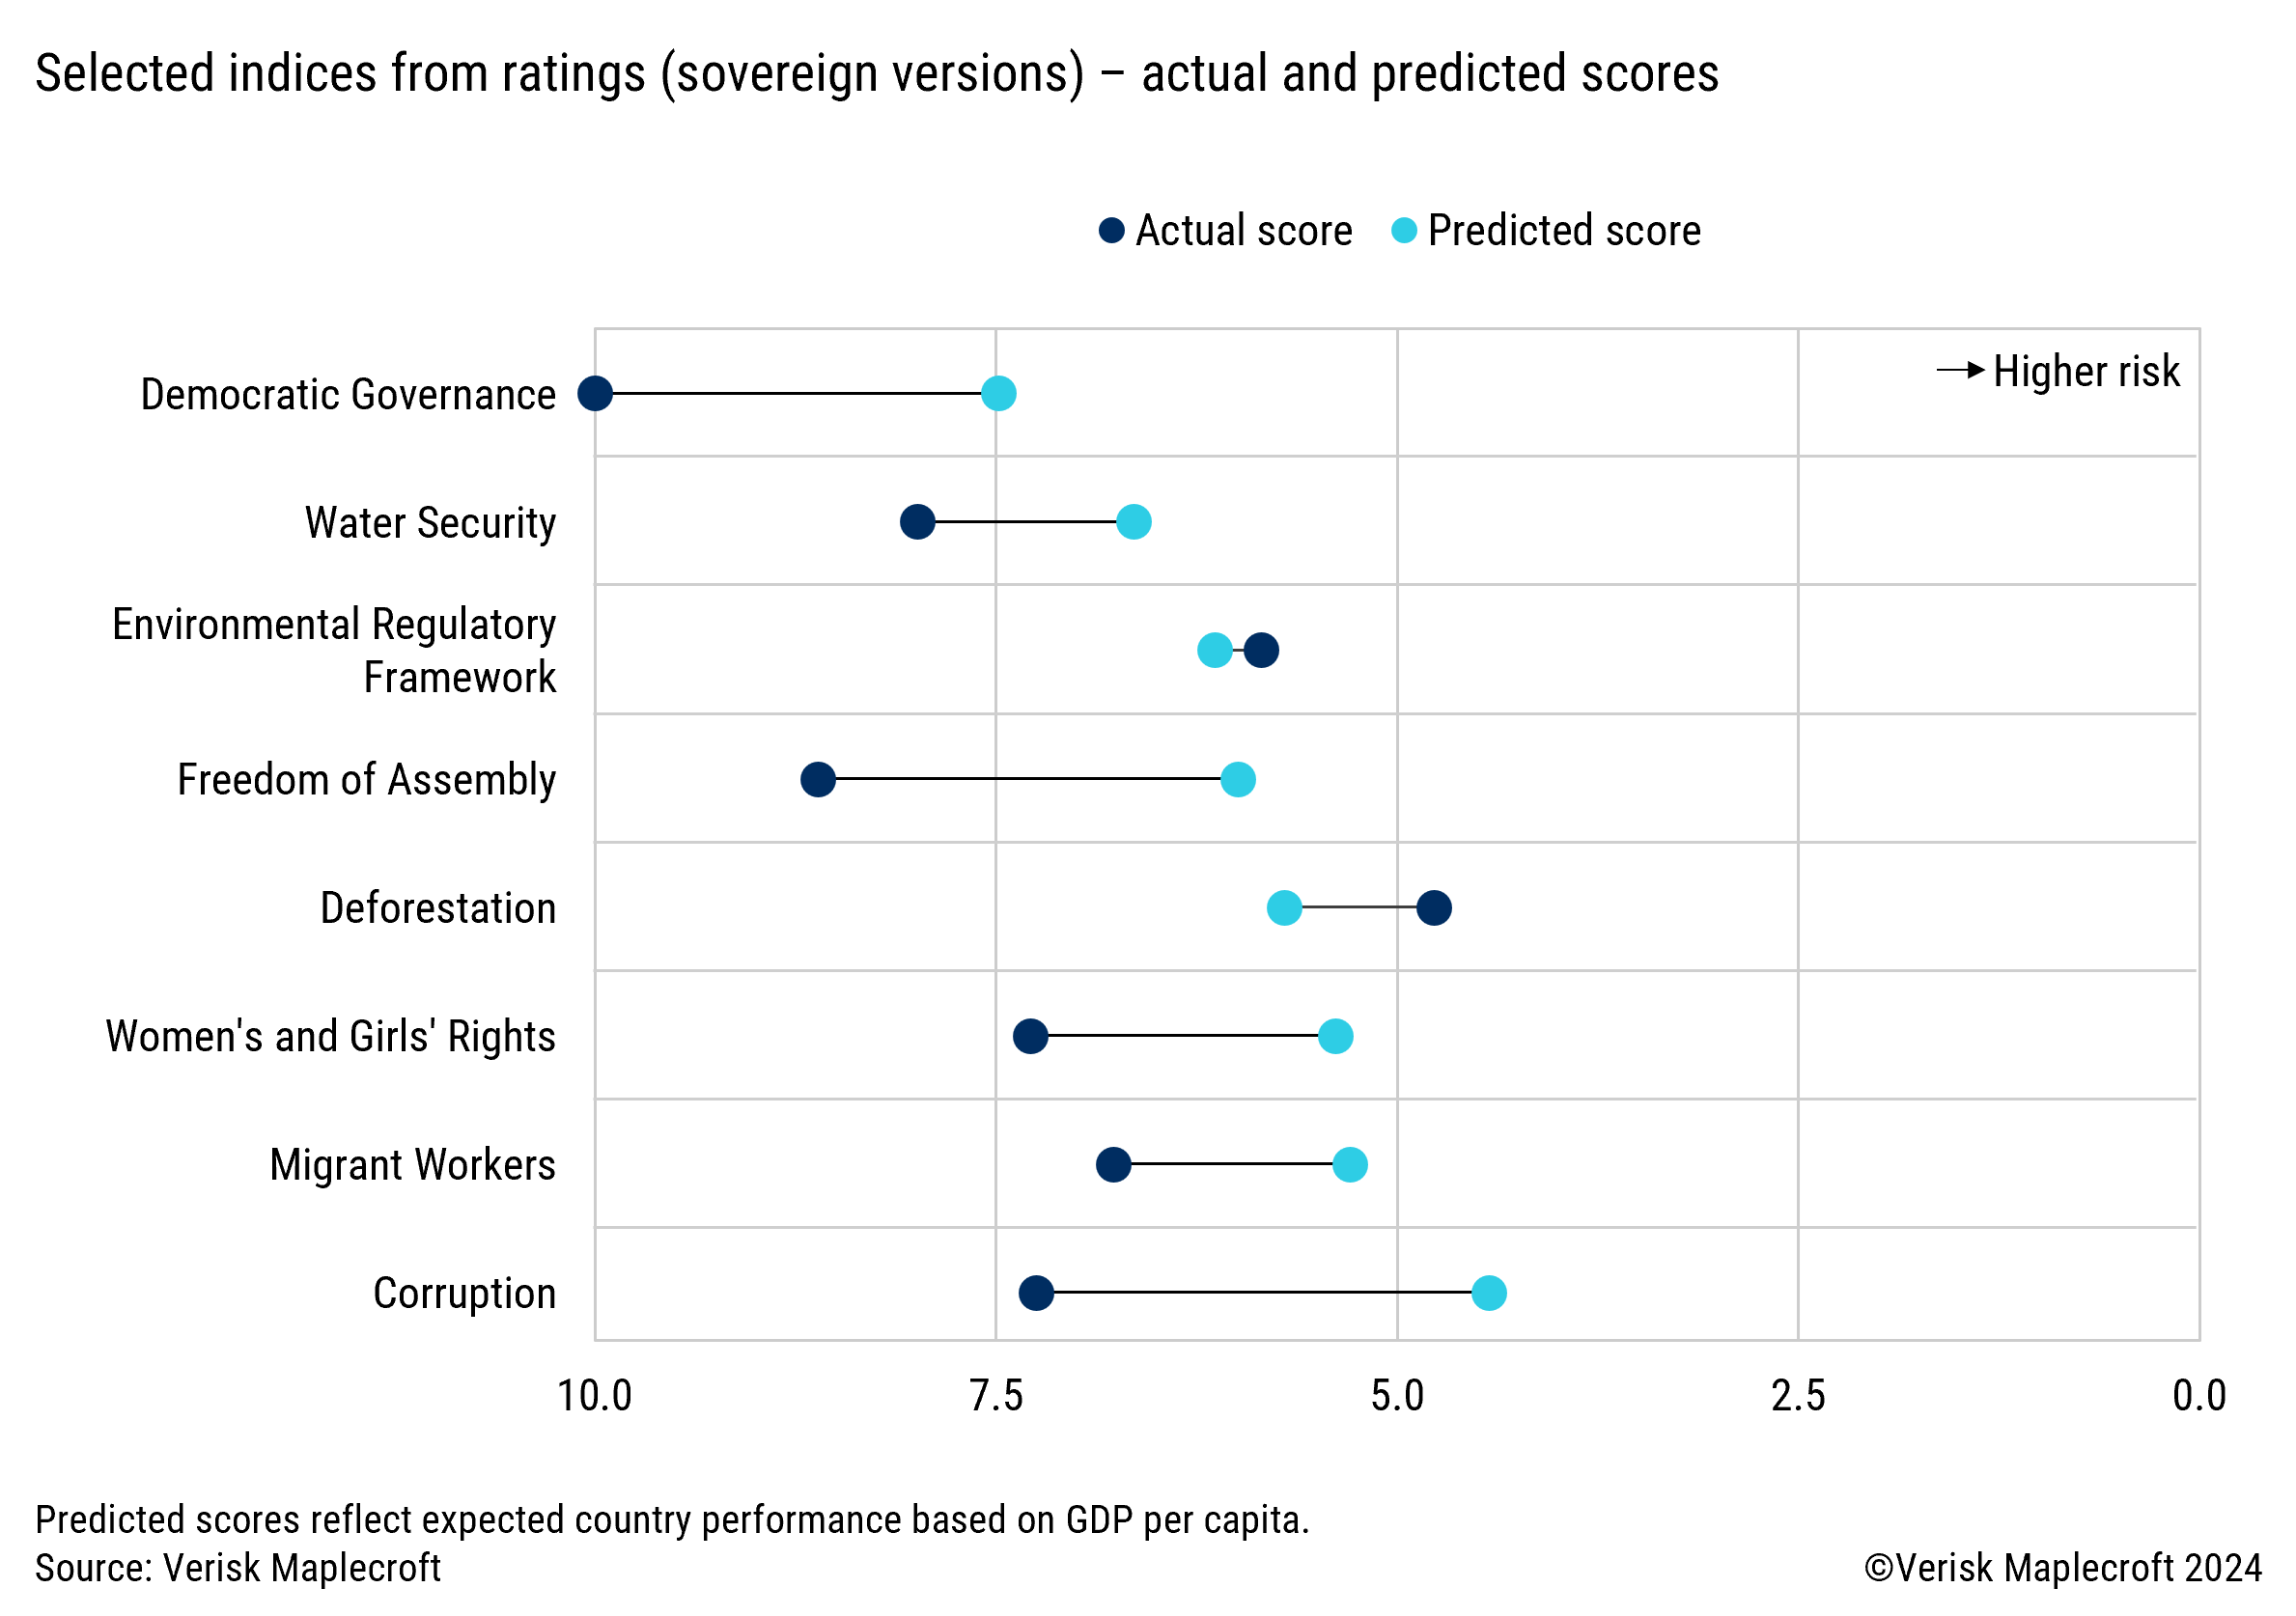
As Figure 2 shows, applying a similar regression analysis to the individual Verisk Maplecroft indices that drive the ratings (see Focus Box for further details), Uruguay does strikingly better than its income peers in delivering key rights protections. Notwithstanding a weaker overall income-adjusted Governance rating, where it is let down by high (and regionally typical) levels of crime, it also performs robustly on democratic governance and corruption. All in all, the country outperforms on 30 of the 37 input indices. Among remaining weaknesses are its environmental regulatory framework, and high deforestation risk.
All other states in our top 10 are in the European Union, reflecting the strong institutional and policy provisions that underpin ESG progress across all member states. This is particularly the case among those at the lower end of the EU’s income scale that might otherwise struggle to find the capacity to prioritise these policy areas or to resource action. But it is not just the poorer EU states that benefit from its foundational provisions: Germany, the bloc’s largest economy, is also a strong performer. With the highest unadjusted score of the group - 90/100 before any adjustment for income - it exceeds predicted scores for its income level in 29 of the 37 indices, most notably those in the Natural Capital Endowment and Protections dimension, as well as on freedom of assembly, corruption, and women’s and girls’ rights.
Across the top 10, the biggest driver of outperformance is the Environment pillar, with all bar Portugal showing positive adjustments here. In contrast, a few see a negative adjustment on the S pillar, while none are boosted on the G pillar.
The laggards: US, Japan and Middle Eastern nations could try harder
At the other end of the scale, our data shows that more than half of all high-income countries (34/62) have ESG profiles that fall short of what might be expected for their given income levels. Figure 1 also shows the 10 major high-income states with the largest negative adjustments, all of them on mediocre or low unadjusted ESG scores. The US, Israel and many of the Gulf states – where oil wealth has yet to translate into broader societal gains, and indeed has acted as an impediment to environmental and governance progress – all see negative adjustments across all three ESG pillars.
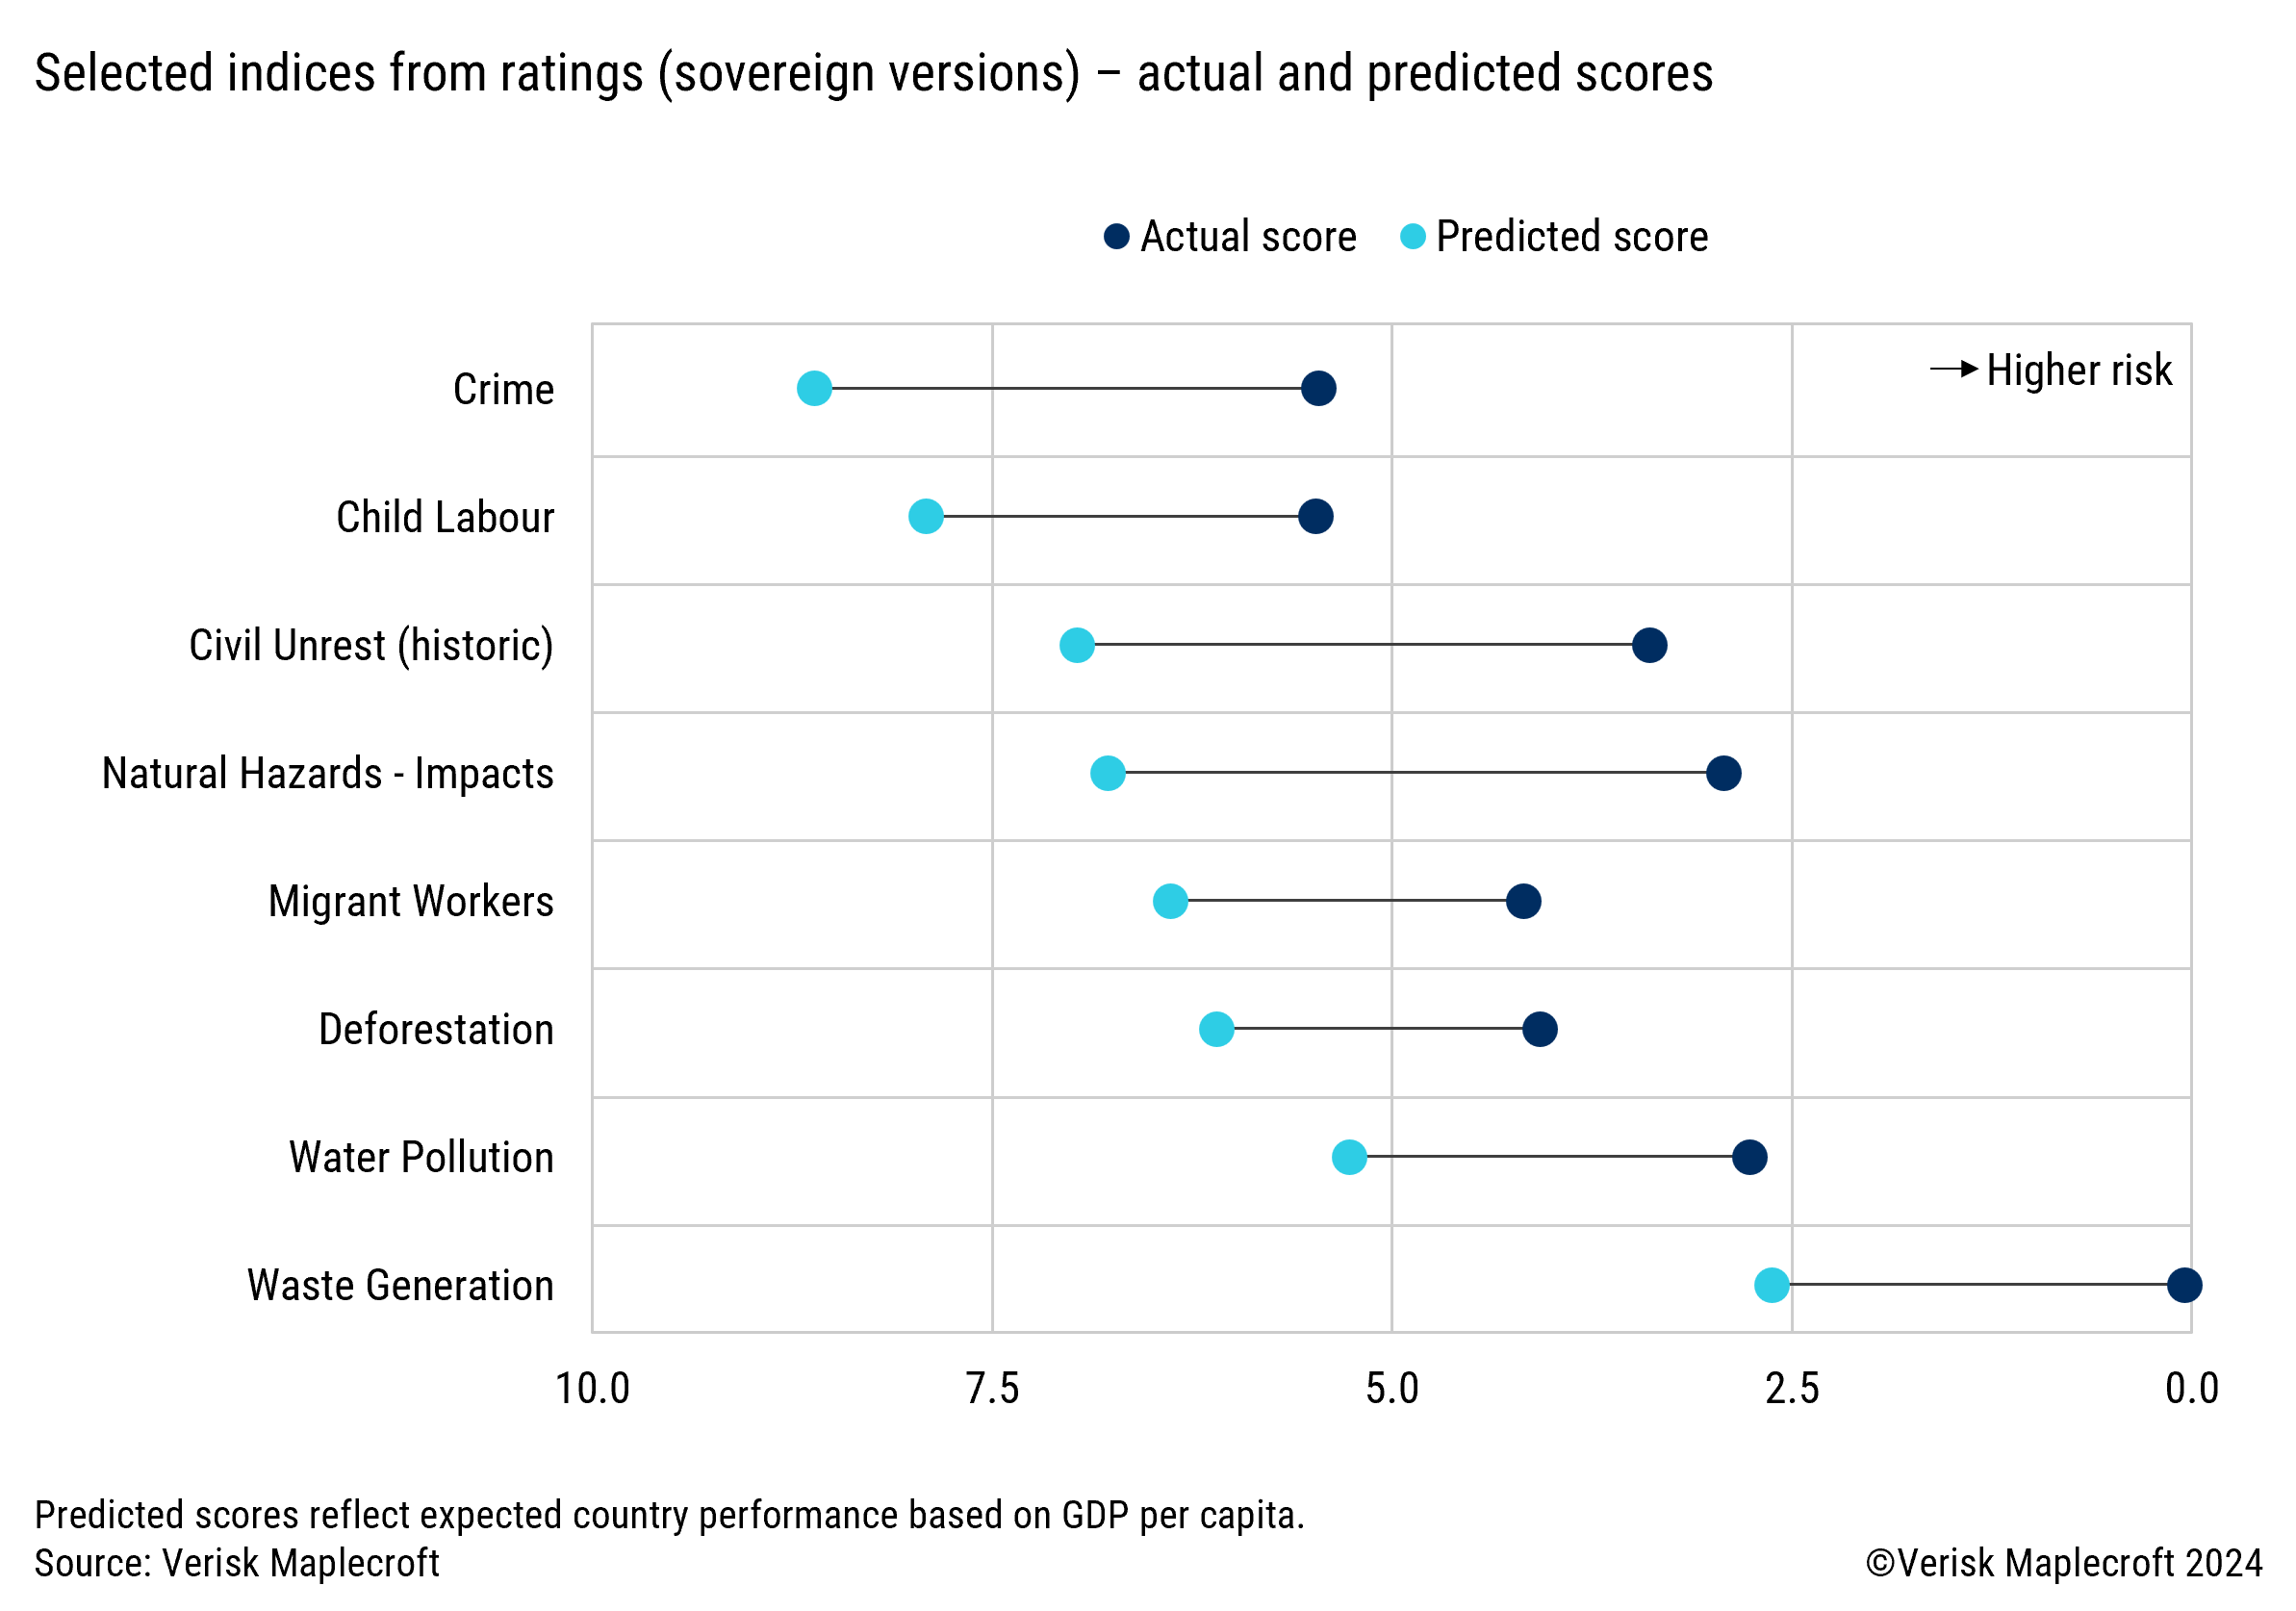
The United States shows the largest negative adjustment of all major high-income states, and the sixth largest of all countries worldwide. From an unadjusted ESG score of 51/100, it falls to just 13/100 on an income-adjusted basis. At the index level it scores below its expected score on 27 of the 37 indices, with a selection of these highlighted in Figure 3. Put another way, it has social risks associated with migrant labour, for example, that would be typical of a country with GDP per capita of approximately US$10,000.
Saudi Arabia, a major hard currency issuer whose growing influence extends well beyond the Gulf countries of the Middle East, similarly falls well short of expectations. Adjusted for income, it has the third-lowest ESG score in the world (after Turkey, another major emerging market with a large negative adjustment, and Libya). Our data reveals stark underperformance across 32 of the 37 input indices in the model, with a selection highlighted in Figure 4. Alongside the country’s well-known human rights and governance challenges, there is also plenty of work still to be done on environmental issues, which are clear potential topics of discussion for investors in any engagement with authorities.
Focus: Accounting for income bias effectively
Using the same type of regression analysis – Nadaraya-Watson – that we use for the overall ratings, we can assess how much countries’ actual performance exceeds or lags what would be predicted given their GDP per capita for each of the 37 indices. Figure 5 shows such a regression for our Freedom of Assembly Index (which feeds into the Human Rights dimension on the Social Pillar), highlighting how Uruguay and Germany outperform their predicted scores while the US and Saudi Arabia fall well short.
Could do better: many high-income countries are looking complacent
As the above data shows, there are some clear cases where rich countries are exceeding what might be expected of them on the delivery of sustainability progress for their given wealth levels, with Uruguay, Germany and many of the smaller EU states ahead of the curve. But it is important to note that numerous wealthy states are substantially failing to deliver. A fitting response from sovereign investors might be to tilt portfolios on an income-adjusted basis, to better account for where scarce resources are being or can be deployed most efficiently. At a time when there are so many competing priorities and large-scale crises vying for attention, we believe that these techniques could be brought to bear to really concentrate minds on the particular areas of the ESG landscape in any given country that require the most urgent attention and engagement efforts.


