Environmental and social risks continue to rise up company agendas, in response to pressure from customers, investors, and legislators for conscientious and sustainable business practices.
All incentives point companies towards doing more to minimise their impact on and exposure to these non-financial risks. Taking into account the adage, “if you can’t measure it, you can’t manage it” then it is clear that comparable data is a necessary starting point for developing the appropriate policies and procedures to respond to these demands. Our indices do just this. Each index – across 150 issues, for 198 countries – is a tool which can support companies in understanding where the highest risks in their supply chains are, what the underlying drivers of these risks are, and how exposed they are across their portfolio of assets.
Take corruption, for example. Corruption is an issue that touches all parts of the supply chain; from manufacturing real estate to boardroom governance. It encourages uncompetitive business practices, misdirects resources – at a cost of 5% of global GDP – and corrodes states’ capacity. Alongside the reputational impacts for a company found to be complicit in corrupt activities, there are increasingly tangible legal implications due to regulations such as the UK Anti-Bribery Act or the US Foreign Corrupt Practices Act.
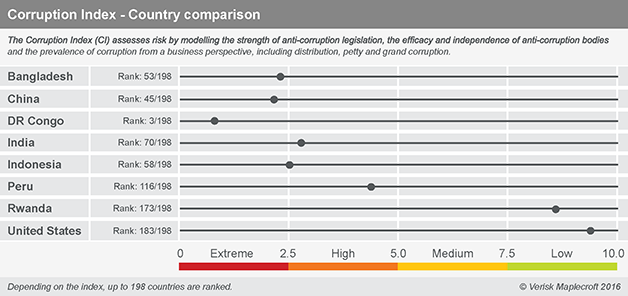
Our Corruption Index assesses ten drivers of corruption to produce a unique score for each country, allowing companies to easily compare their exposure to risks across their countries of operation.
A glance at the index results can tell a retailer that corruption risks are higher in Bangladesh (2.29/10, where 0 indicates highest risk) than in India (2.79/10). An extractive company can see corruption is pervasive in DR Congo (0.89/10), or even across all of Central Africa (2.18/10) - less so in Peru (4.32/10) or South America (4.19/10). Assessing the relative context of their risks globally helps companies make efficient strategic decisions: from how much risk they are exposing themselves to by doing business in a new country, to where to prioritise finite budgets focused on risk mitigation.
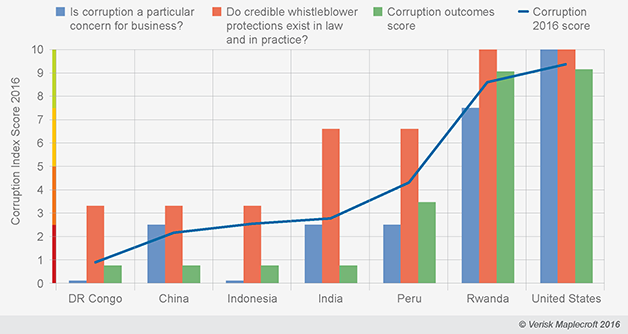
Beyond helping making sense of high-level risk, a second way of using the Corruption Index is to unpack the indicators which makeup the index, helping companies understand a country’s corruption story.
On the chart below, the indicators colour each country’s overall performance. In Central Africa, Rwanda’s low-risk score on the ‘Corruption Outcomes’ indicator stems from the government’s extensive efforts to create an effective system, including more than 10 anti-corruption bodies. In contrast, poor performance across all indicators demonstrates that while there are some legal protections in DR Congo, anti-corruption efforts are not enforced; corruption is widespread and entrenched.
In Asia’s manufacturing hubs, China (2.15/10), Indonesia (2.55/10) and India (2.79/10) all have similar Corruption scores. However, the indicators unveil that corruption is a more important operational factor for businesses in Indonesia than in China or India, helping companies make a critical distinction on where anti-corruption training and stringent procedures will be most effective. The indicators also reveal that whistle-blowers are most protected in India, suggesting a range of company policies from added internal protections for whistle-blowers in China and Indonesia, to showcasing successes in India.
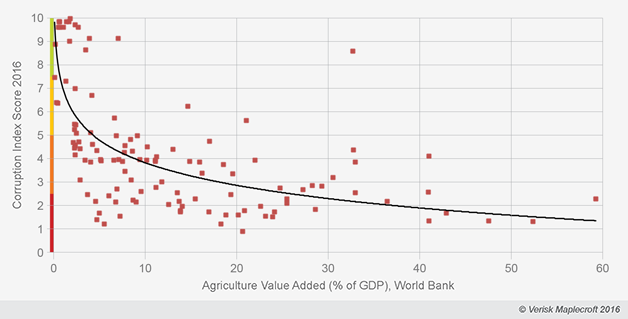
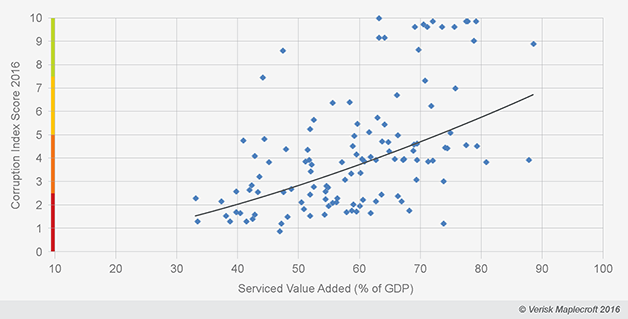
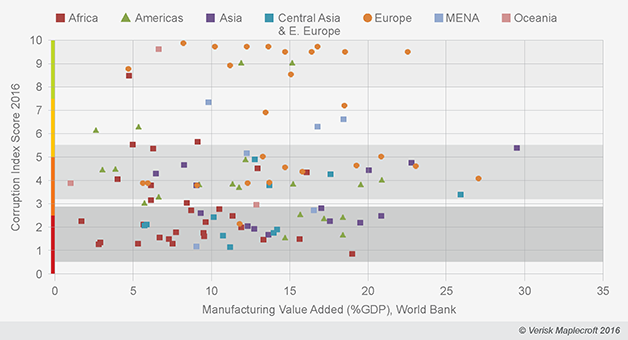
A third way of using the index is to combine it with external data sources to gain insight into the industries which are most exposed to corruption in different environments. The series of charts below clearly show that economies dominated by agriculture correlate to higher corruption risks, whereas service-sector economies are correlate with lower risk exposure. While an overall trend in manufacturing economies is less clear, there are three distinct bands of risk exposure, which do broadly conform to regional bounds (where European countries prevail in the lowest-risk band).
This simple comparison is effective in providing high-level insight and further exploration into corruption risks in supply chains or investment portfolios. By combining relevant data companies can make strategic or prescriptive decisions: a responsible sourcing team could use this insight to focus anti-corruption resources on suppliers providing agricultural goods; while an ESG fund looking to reduce its exposure to corruption could use this information to reshuffle its portfolio to a heavier weighting towards services equities.
Tackling corruption throughout the supply chain is worth the investment. Aside from improving margins in the long term, managing and mitigating the impact of corruption protects companies from associated reputational risks and the legal consequences of corruption among their suppliers. Taking steps to understand risk exposure is the all-important first step to securing these advantages.
Our offering of more than 150 political, human rights, environmental and economic indices are available alongside a selection of analytical features, including calculators and supply chain management tools. All come with access to the full methodology and access to the underlying indicators.
Qualitatively-scored indices are designed to work with standard reporting mechanisms such as the Global Reporting Initiative, and Structure (legal), Process (implementation) and Outcome indicators correspond with the UN Guiding Principles on Business and Human Rights (UNGP) ‘respect, protect, remedy’ framework.
To discuss this topic with an analyst or to request a Country Risk Report contact info@maplecroft.com.